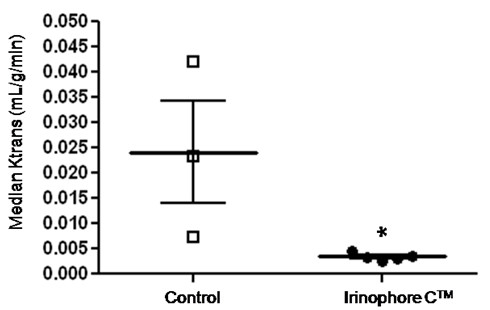
Figure 5.

Irinophore C™ reduced Ktrans measures compared to values obtained from control orthotopic tumors. Individual and median (thick line) Ktrans values for untreated and Irinophore C™ treated orthotopic tumors with standard error of the mean (thin line). Statistical significance is indicated (*p-value ≤ 0.05).
