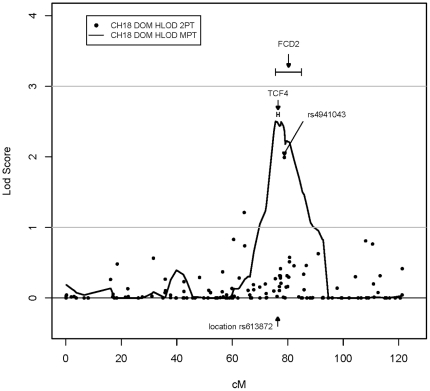
Figure 1. Plot of the top multipoint linkage peak on chromosome 18.
SNP markers are plotted along the x-axis by their deCODE map position, and the LOD/HLOD scores for each marker are plotted along the y-axis. The results of the FASTLINK/HOMOG dominant two-point analysis are indicated with black circles, and the results of the MERLIN dominant multipoint analysis are indicated with a black line. The SNP rs4941043 is the peak marker from the two-point analysis (see Table 3 ). The location of the FCD2 peak (Sundin et al., 2006) and the most significantly associated SNP, rs613872, from the FECD GWAS performed by Baratz et al. (2010) are indicated by arrows. The location of the TCF4 gene is also indicated for reference. 2PT, two-point results; MPT, multipoint results; cM, centiMorgans; LOD, logarithm of the odds; HLOD, heterogeneity logarithm of the odds.

