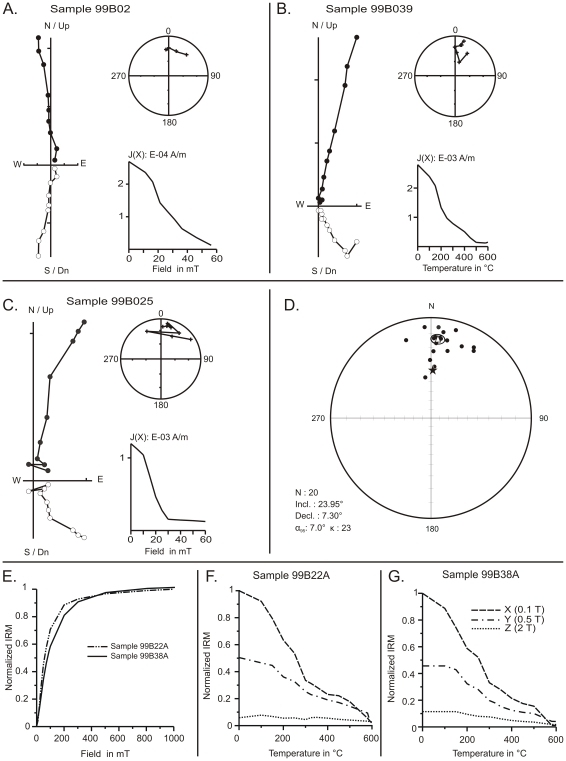
Figure 8. Paleomagnetic analyses of the samples from the hominoid section.
A–C: Orthogonal vector diagrams (closed/open symbols correspond to the horizontal/vertical component), stereoplots (crosses: upper hemisphere, circles: lower hemisphere), intensity and step plots for representative samples after thermal and alternating field demagnetization. D: Equal-area stereographic projections of site mean ChRM directions. Open triangle: site mean direction (Declination = 7.3°; Inclination = 23.9°; α95 = 7; k = 23; n = 20), Ellipse: 95% confidence ellipse for mean direction. Solid star: direction derived from the 10-Ma apparent polar wander path. E: Isothermal remanent magnetization (IRM) acquisition curves (normalized values) for two representative samples. F–G: Stepwise thermal demagnetization of the differential IRM components (X, Y, and Z). 99B022A: medium grained sandstone. 99B039A: grey claystone.

