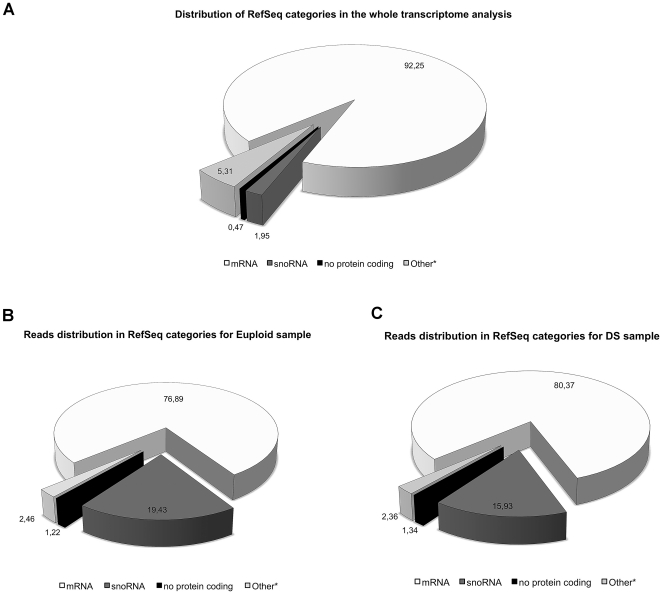
Figure 1. RefSeq categories and reads distribution.
Distribution of the abundance of the RefSeq categories (HGNC) in the observed actively transcribed loci of the two states (A); Distribution of the UARs across the distinct RefSeq categories. DS (B) and euploid (C). The “other” category, marked with asterisk, include less represented RNAs (pseudogenes, microRNA, snRNA, scRNA, antisense, vault and RNAse) according to HGNC. Percentages are shown in the pie chart.

