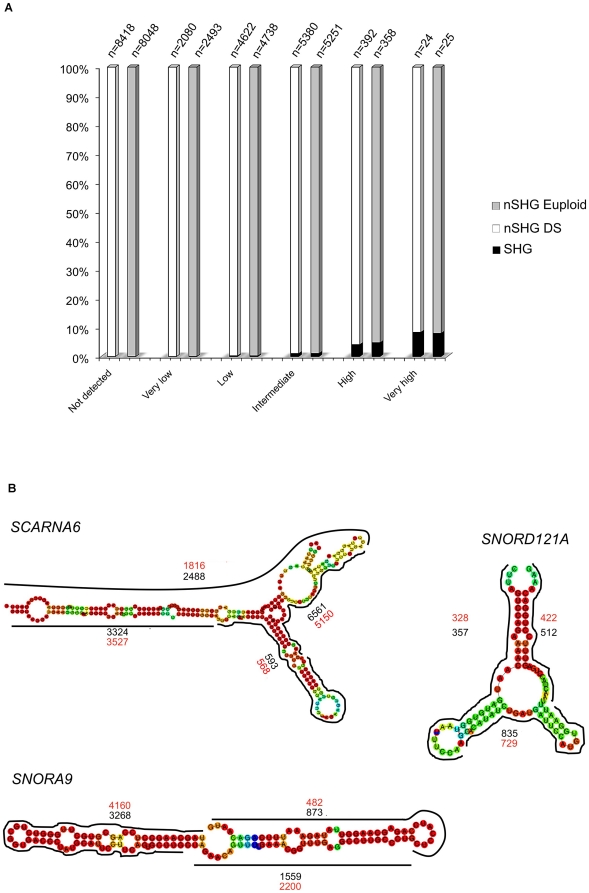
Figure 5. snoRNAs expression and mapping block patterns.
(A) illustrates the percentage of snoRNAs host genes (SHG) vs non host genes (nSHG) within each RPKM category for both DS and euploid samples. (B) is a schematic representation of maximum coverage of few examples of snoRNAs, showing a characteristic mapping block pattern. Black and red numbers refer to DS and euploid maximum coverage, respectively.

