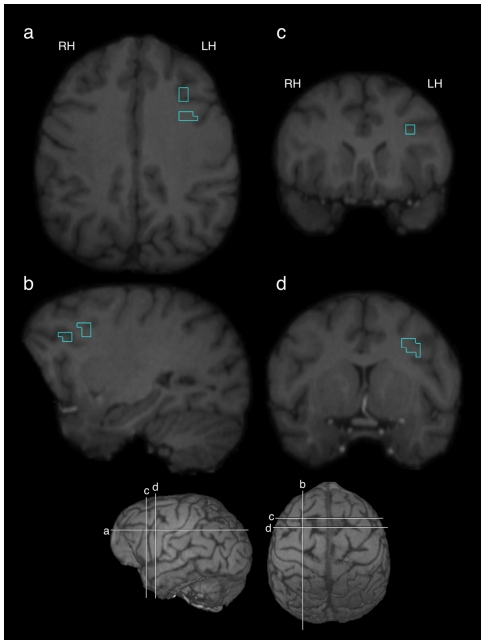
Figure 1. Significant cluster of activation identified previously using PET [17] overlaid on a representative chimpanzee brain.
Traces represent boundaries of the region in the three orthogonal planes: transverse (a), sagittal (b), and coronal (c & d). Bottom panel indicates locations of 4 images (a, b, c, & d) on a representative 3-D rendered chimpanzee brain.

