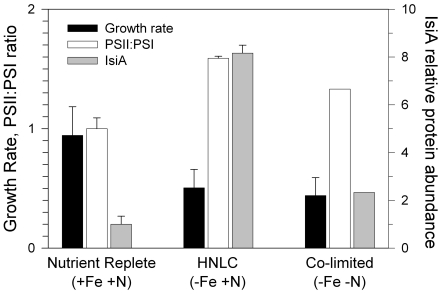
Figure 1. Comparison of growth rates and protein abundance.
Response of wild type Synechocystis sp. PCC 6803 growth rate (d−1), PSII∶PSI ratio (normalized to nutrient replete conditions) and IsiA abundance (normalized to background density value) for the three steady-state nutrient conditions (labelled at bottom). Error bars are standard deviations of duplicate cultures.

