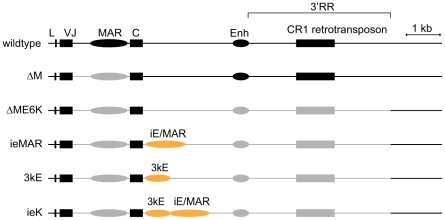
Figure 1. Schematic representation of the IGL loci in individual DT40 lines.
The rearranged allele of the IGL locus in the indicated cell lines is drawn to scale. The leader (L), the VJ exon, constant region (C), and the CR1 retrotransposon (present in the published chicken genome as well as in DT40 cells, S.D.F. unpublished) are shown as filled boxes. The putative matrix attachment region (MAR) and the 467 bp enhancer (Enh) are shown as filled ovals. Elements that are present are shown in black, those that are deleted are in grey. The murine enhancer elements (iE/MAR and 3kE) in the respective knock-in alleles are depicted as orange ovals.

