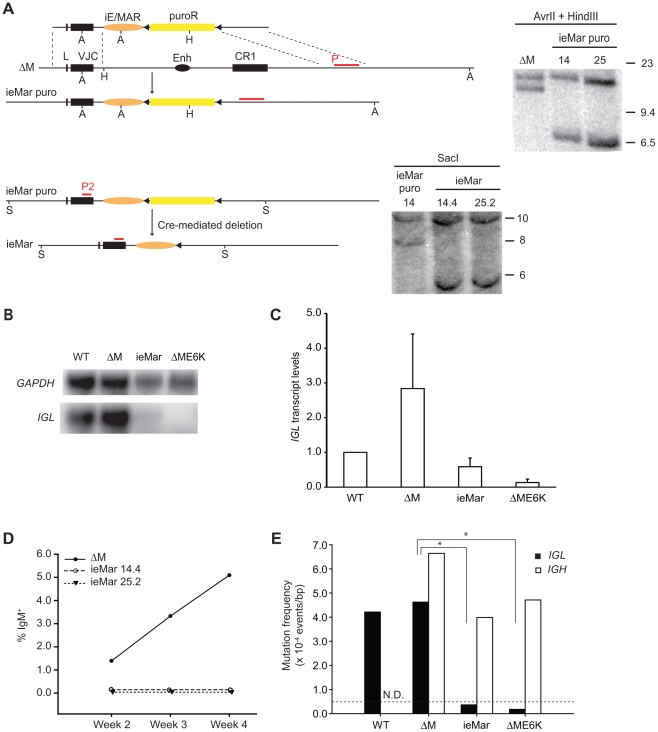
Figure 2. Functional analysis of the iE/MAR enhancer element.
A) Schematic representation of the gene-targeting approach. The rearranged IGL allele of the parental ΔM line, the intermediate ieMAR puro allele, and the final product, the IGL locus of the ieMar DT40 cells, are drawn to scale. The targeting vector is shown with its homology arms, the iE/MAR (orange oval), the puromycin selection cassette (yellow box) and flanking loxP sites (filled triangles), but the plasmid backbone is omitted for clarity. The restriction sites used for the Southern blot analyses are marked (A: AvrII, H: HindIII, and S: SacI), and the probes for each step (P1 and P2, respectively) are shown as red lines above the locus. The asterisk in each Southern blot marks the band that originates from the non-rearranged allele. B) Northern Blots were run using 10 µg of total RNA of wild-type (WT) DT40 cells and each of the indicated cell lines, and hybridized sequentially with IGL and GAPDH probes. One representative example is shown. C) Steady-state transcript levels of IGL were measured by Northern blot and normalized to those of GAPDH. The level in wild-type (WT) cells was arbitrarily set to one, and each data point represents the average of at least four independent values per genotype. D) GCV was assessed by flow cytometry over four weeks starting from single cell clones. The average percentage of IgM+ cells in a total of 24 subclones from two independent ieMar lines is shown at each time point. E) Mutation event frequencies in the IGL (filled bars) and IGH (open bars) loci were determined by sequencing the VJ or VDJ exon from two independent subclones after four weeks of continuous culture. The background level of 0.5×10⁻⁵ events/bp for this system was determined in AID-deficient DT40 cells [23], and is shown as a dotted line. The data for wild type (WT) and ΔME6K were obtained from [13]. Asterisks indicate p<0.005 in a Student's t-test.

