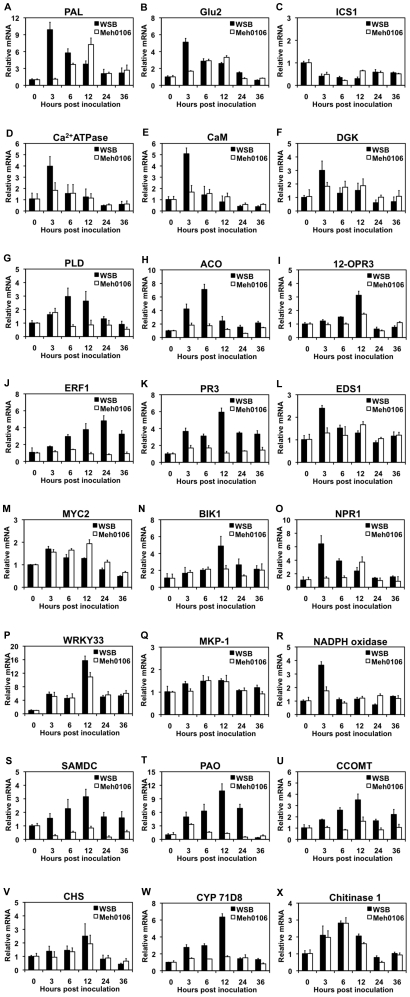
Figure 5. Expression profiles of PAL (A), Glu2 (B), ICS1 (C), Ca2+ ATPase (D), CaM (E), DGK (F), PLD (G), ACO (H), 12-OPR3 (I), ERF1 (J), PR3 (K), EDS1 (L), MYC2 (M), BIK1 (N), NPR1 (O), WRKY33 (P), MKP-1 (Q), NADPH oxidase (R), SAMDC (S), PAO (T), CCOMT (U), CHS (V), CYP71D8 (W) and Chitinase 1 (X) in Wangshuibai (WSB) and Meh0106 spikes after F. graminearum infection.
The expression levels were relative to no inoculation (0 h) after normalization of the qRT-PCR outputs with the wheat tubulin gene output. RT-PCR was performed using gene-specific primers (Table S4). The experiment was repeated three times with similar results. Data were presented as average + S.D with n = 3.

