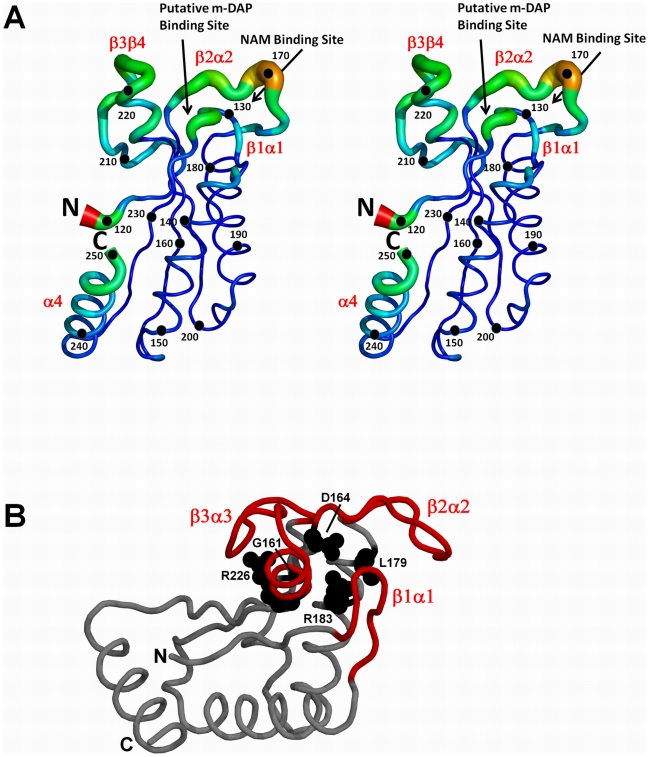
Figure 1. The crystal structure of H. pylori MotB-C and the locations of the conserved residues.
A: Stereo diagram of the structure of the H. pylori MotB-C monomer. The backbone radius is proportional to the average Cα atom RMSD to the mean structure for the superimposition of the total of 16 monomers in the asymmetric units of Form A and Form B crystals. RMSD values were calculated using Theseus [11] and the figure was prepared using PYMOL [12]. The color gradient runs from blue (the smallest RMSD) to red (the largest RMSD). B: The location of the five residues conserved in the family of OmpA-like PG-binding proteins. The MotB-C monomer is drawn using a ribbon representation. Loops β1α1, β2α2 and β3β4, masking these residues, are colored red.

