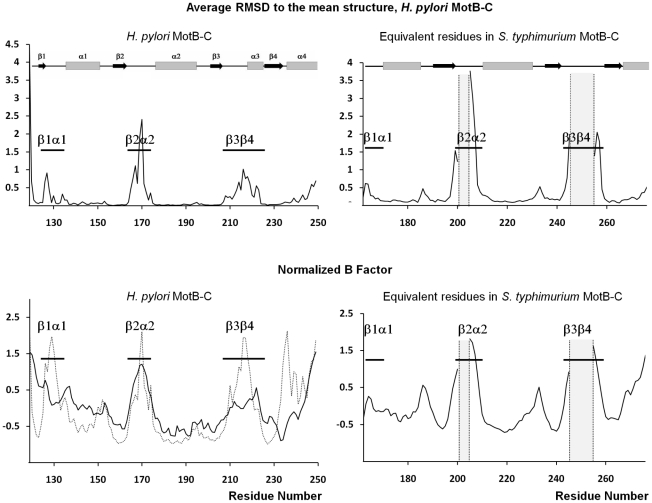
Figure 2. The analysis of the conformational flexibility of MotB-C.
A: Average Cα atom RMSD to the mean structure as a function of residue number. RMSD for H. pylori MotB-C was calculated with the superimposition of the total of 16 monomers in the asymmetric units of Form A and Form B crystals. RMSD for S. typhimurium MotB-C was calculated with the superimposition of the total of five monomers in the asymmetric units of the three available crystal forms (PDB accession codes 2ZOV, 2ZVY and 2ZVZ [7]. Residues 201–204 and 246–254 are disordered in some S. typhimurium MotB-C monomers and were therefore excluded from calculations. The positions of the secondary structure elements (α-helices and β-strands) are shown on top. B: Experimental (crystallography, solid line) and theoretical (MD simulations, dotted line) normalized main-chain temperature factor B. B equals 8/3π2 u 2, where u 2 is the mean-square displacement of an atom about its mean position. The crystallographic B values for H. pylori MotB-C have been averaged over 12 monomers in the asymmetric unit of the Form B crystal. The crystallographic B values for S. typhimurium MotB-C have been averaged over 5 monomers in the three crystal forms. The B-factors were normalized to zero mean and unit variance. The positions of the three carbohydrate-binding loops are indicated.

