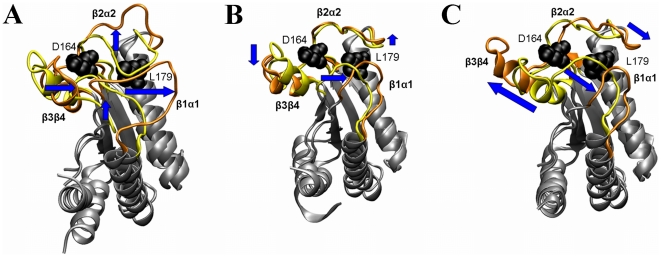
Figure 3. MD motion profiles 1 to 3 along the first three PCA eigenvectors.
The two extreme projections of the loops are shown for each motion profile. These extreme conformations (yellow and orange) correspond to artificially heated (2kT above the ground state) conformations for ease of interpretation. The arrows represent the directions of motions between the extreme conformations (here arbitrarily taken as yellow to orange). The side chains of Asp164 and Leu179 are shown in black using a ball representation.

