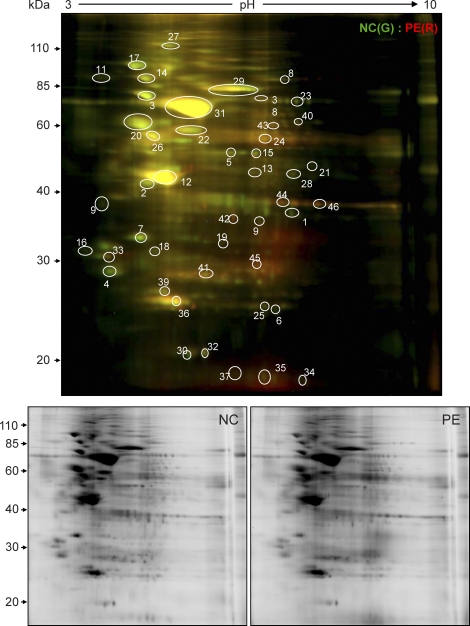
FIG. 4.
Analysis of nitroso-proteomes in normotensive and preeclamptic placentas by CyDye switch/2D-DIGE. Total placental extracts (50 μg/sample) were assayed. Control samples were labeled with Cy3 (green), and preeclampsia samples were labeled with Cy5 (red). The samples were mixed (total, 100 μg) and then separated using analytical 2D-DIGE. The gel was scanned with a fluorescence scanner at different transmission and emission wavelengths for Cy3 (green, 548/560 nm) and Cy5 (red, 641/660 nm). The merged fluorescence image represents one of three separate experiments using samples from different placentas. Red, green, and yellow spots represent SNO-proteins that were increased, decreased, or unchanged by preeclampsia, respectively. The spots circled and numbered represent 46 SNO-proteins (Table 2), which were identified by MALDI-TOF-MS/MS. The black and white images represent fluorescent signals obtained from the red and green channels of one of the three experiments. NC, normotensive; PE, preeclampsia.

