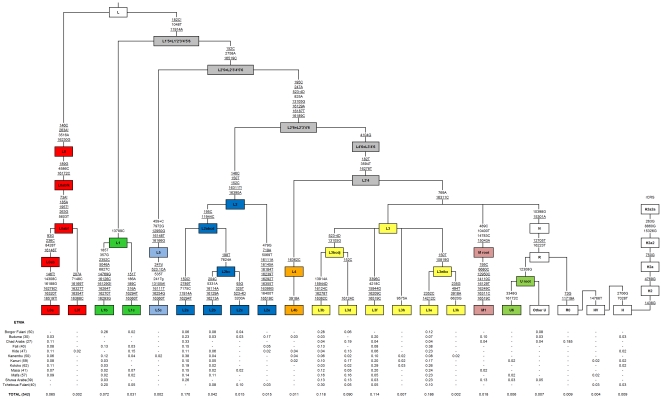
Figure 2. Phylogeny of African hgs at a medium level of phylogenetic resolution and (below branches) counts of these hgs for the different ethnic groups.
Bottom of the figure: population labels have in brackets the sample sizes; numbers below branches indicate the hg relative frequencies in each population group and in the total sample size (row “Total”); therefore, each row sums to 1. The counts for the maximum level of resolution are provided in Table S2; the full phylogenetic tree for the SNPs considered in the present study is provided in Cerezo et al. [22]. All positions in the tree refer to the revised Cambridge Reference Sequence (rCRS; [49]); all positions are transitions unless a letter indicates a transversion. Underlined positions are parallel mutations within this tree, while “!” indicates a back mutation. A deletion is indicated as “del”, while “+” indicates an insertion.

