
Figure 4.
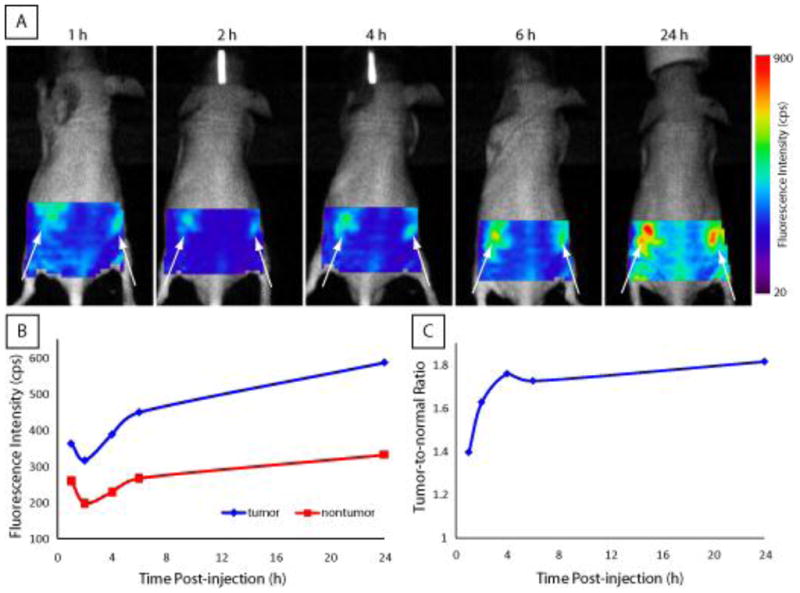
(A) Fluorescence image of LS 573 in 4T1/luc tumor-bearing mouse at indicated times after intravenous administration. Arrows indicate bilateral subcutaneous tumor locations. (B) Plot of average fluorescence intensity values for tumor regions compared with non-tumor control region selected in vivo imaging data. (C) Plot of in vivo tumor contrast at each timepoint showing that high contrast was achieved by 4 h and was maintained for at least 24 h post-injection.