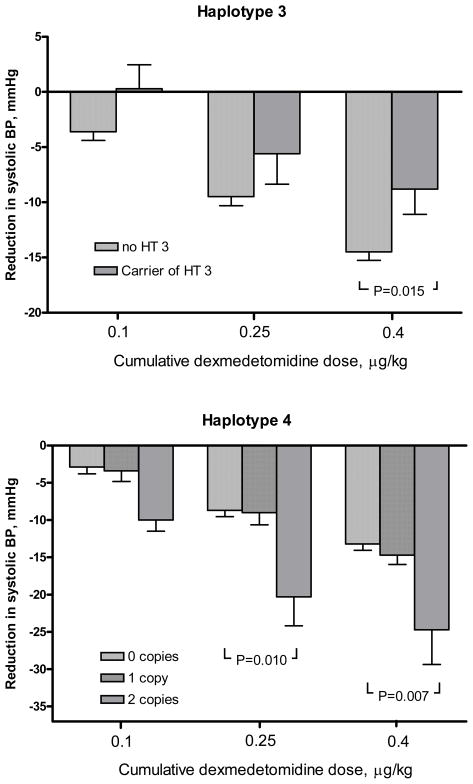
Figure 2. Reduction in systolic blood pressure during dexmedetomidine.
The bar graphs depict the reduction in systolic BP from the last placebo infusion after each of three dexmedetomidine infusions, stratified by number of copies of haplotype 3 (upper panel) and haplotype 4 (or rs553668 minor alleles; lower panel). For statistical analysis, the single subject homozygous for HT3 was grouped with the heterozygous carriers. Error bars represent standard errors of the mean.

