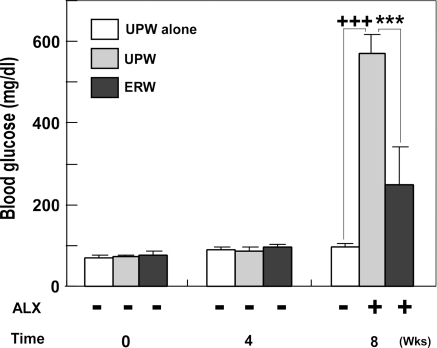
Fig. 3.
The effects of ERW on blood glucose levels of normal and ALX-induced diabetic CD-1 mice. CD-1 mice were treated as described in the study protocol (Fig. 2). Blood glucose levels at the 0, 4 and 8th week time points are presented. Each value denotes the means ± S. E. M., calculated from the data of survived mice. Plus symbols represent significant differences observed between UPW-administrated mice without ALX treatment (UPW(−)ALX) and UPW-administrated mice with ALX treatment (UPW(+)ALX) (+++p < 0.001) or ERW-administrated mice with ALX treatment (ERW(+)ALX) (+p < 0.05). Asterisks represent significant differences observed between UPW(+)ALX and ERW(+)ALX (*** p < 0.001)

