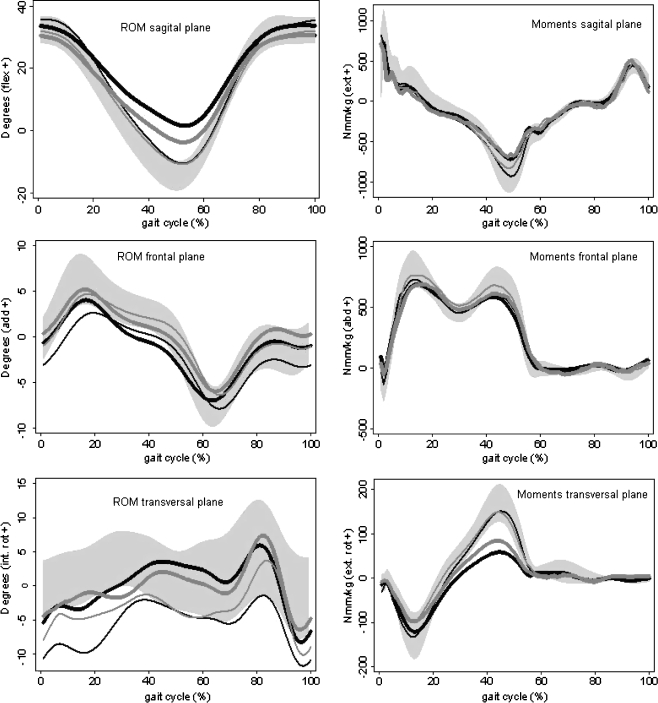
Fig. 2.
Averages of joint angle profiles (ROM) and moments in all anatomical planes during a gait cycle walking at a self-selected speed for the operated and non-operated hips in the hip resurfacing system (HRS) and conventional hybrid prosthesis (MHE) groups 12 weeks after surgery, and the average values of both hips in the control group. The HRS group is represented by the black lines (bold operated hip, narrow non-operated hip); the MHE group is represented by the grey lines (bold operated hip, narrow non-operated hip). The shaded areas represent equal boundaries of ±1 standard deviation (SD) for controls

