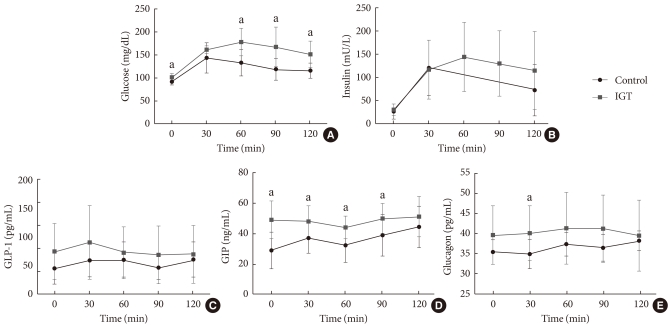
Fig. 2.
Plasma concentrations of glucose (A), insulin (B), glucagon like pepide1 (GLP-1) (C), glucose-dependent insulinotropic polypeptide (GIP) (D), and glucagon (E) after the ingestion of 75-g oral glucose in 13 women with impaired glucose tolerance (IGT) (square symbols) and 11 control women (round symbols). Data are presented as means±standard deviation; P values were calculated using repeated measures ANOVA. aSignificant differences at individual time points (P<0.05 by one-way ANOVA).

