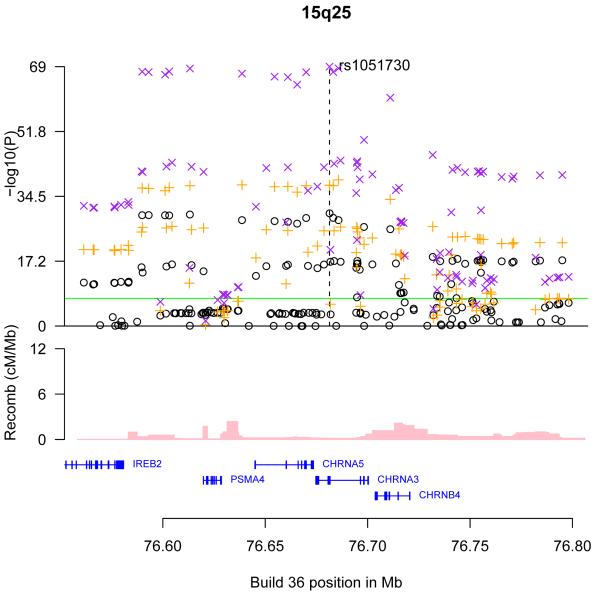
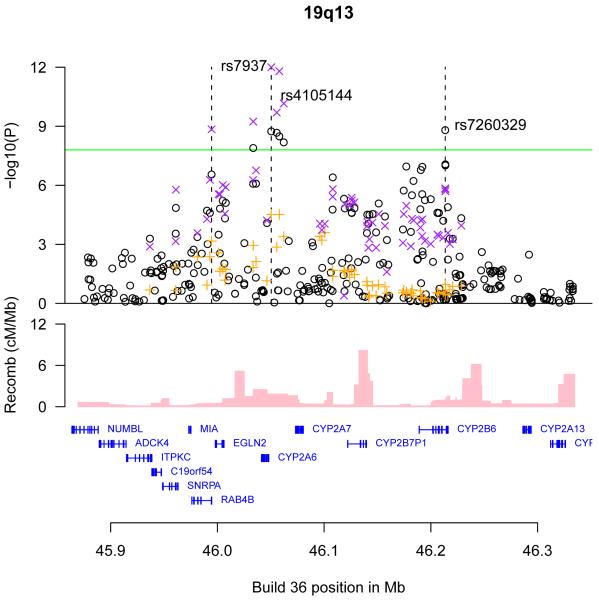
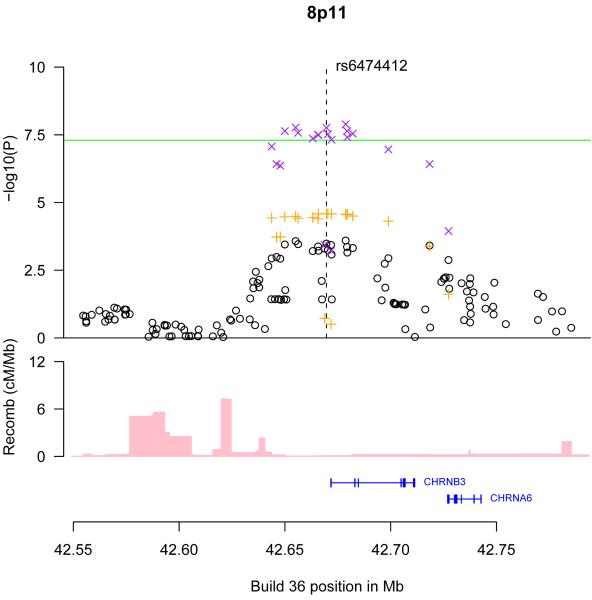
Figure 1.
The genomic regions of association with CPD on chromosomes 15q25 (A), 19q13 (B), and 8p11 (C) and 7p14 (D). Shown are the −log10 association P values of SNPs in the region with CPD from the ENGAGE meta analysis (black circles), the in silico replication studies (orange crosses), and joint analysis of ENGAGE, TAG, and OX-GSK GWA data (magenta crosses), the SNP build 36 coordinates, the genes in the region and their exons (in blue) and recombination rates in centimorgans (cM) per megabase (Mb) (pink histogram).


