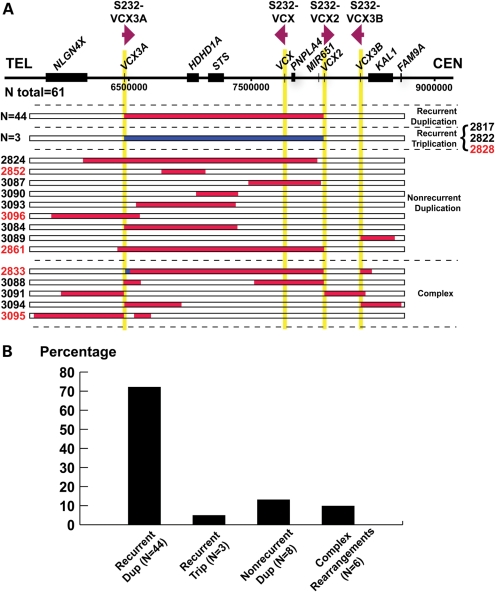
Figure 1.
Summary of aCGH results. (A) A schematic representation (top) of Xp22.31 genomic region based on the reference genome (hg18). Individual genes are shown as black rectangles. The vertical yellow shadow areas represent S232 LCRs, with the relative orientations of each of the LCR indicated. Below, horizontal bars depict the involved genomic intervals for each subject from the interpretations of aCGH results. Red bars represent duplications and blue bars represent triplications; white normal copy. Colors of subject numbers indicate genders, with black depicting male and red female individuals; 44 subjects (27 males, 17 females) carry recurrent duplications as shown in the top row. (B) Distribution of different rearrangement types. Note that BAB2861 is classified as carrying a complex rearrangement here because breakpoint analysis described later revealed complex rearrangements in this subject.

