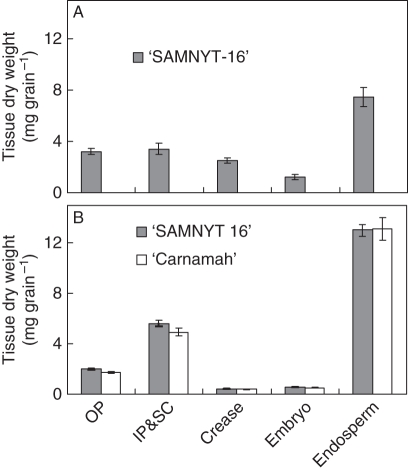
Fig. 2.
Dry weights of the various sections of wheat grain [outer pericarp (OP), inner pericarp plus seed coat (IP&SC), crease (combination of vascular bundle and nucellar projection), embryo and endosperm], in (A) expt 1 (21 DAA) and (B) expt 2 (24 DAA). Data in expt 2 represent averages of the two Zn levels as no significant differences were observed. Error bars represent standard errors of, respectively, seven and three replications.

