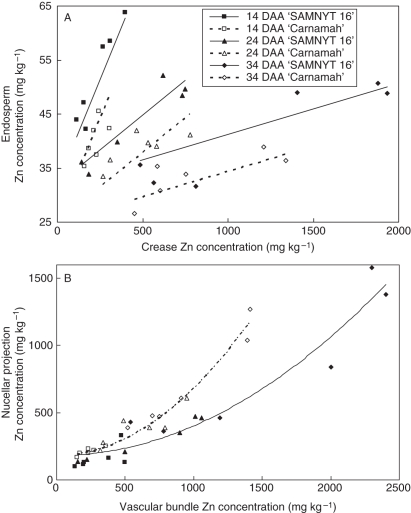
Fig. 6.
Optimum regression model explaining 83 % of the variance in endosperm concentration was obtained with a linear regression of endosperm Zn concentration on crease Zn concentrations (A), showing significantly (P < 0·01) different slopes between harvests (0·0776, 0·0258 and 0·0094 for harvests 14, 24 and 34 DAA, respectively, with a standard error of 0·0063) and significantly (P < 0·01) different intercepts between the two cultivars (31·8 and 25·0 for ‘SAMNYT-16’ and ‘Carnamah’, respectively, independent of the harvest time, with a standard error of 1·34). An optimum regression model explaining 94·0 % of the variance in nucellar projection Zn concentration was obtained with a regression on vascular bundle Zn concentration (B) allowing for a quadratic term (P < 0·001) with a different coefficient for the two cultivars (P < 0·001).

