Fig. 8.

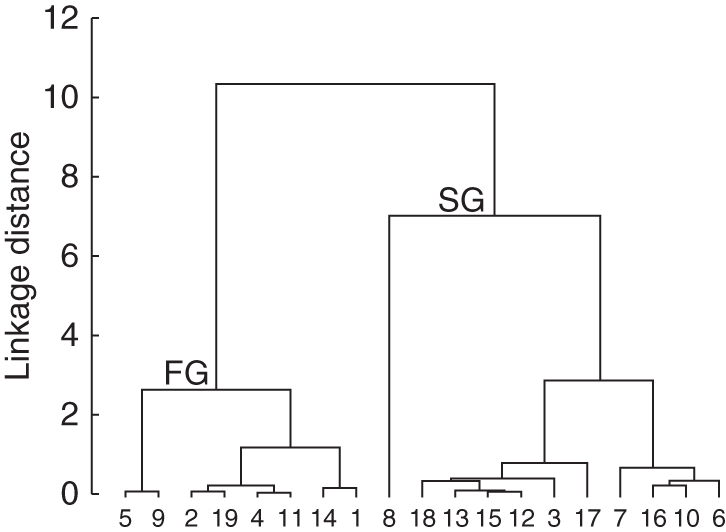
Dendogram of the cluster analysis. The cluster supports the division according to germination rate and lag time. Fast germination (FG) and slow germination (SG).

Dendogram of the cluster analysis. The cluster supports the division according to germination rate and lag time. Fast germination (FG) and slow germination (SG).