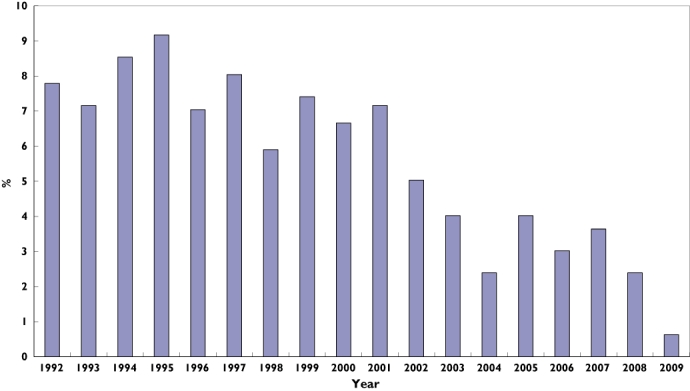
Figure 1.

Distribution of cases by year of cohort entry. Each bar represents the proportion of elderly patients hospitalized with phenytoin toxicity in Ontario for a specific year over a 17-year period (1992 to 2009). Proportion of Cases (%) ( )
)

Distribution of cases by year of cohort entry. Each bar represents the proportion of elderly patients hospitalized with phenytoin toxicity in Ontario for a specific year over a 17-year period (1992 to 2009). Proportion of Cases (%) ( )
)