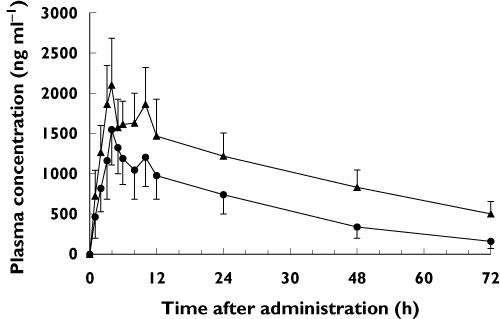
Figure 1.

Plasma concentration–time profiles for meloxicam in CYP2C9 genotype groups after a single 15 mg oral dose of meloxicam. Each value represents the mean ± SD. •, CYP2C9*1/*1 (n = 12); ▴, CYP2C9*1/*13 (n = 9)

Plasma concentration–time profiles for meloxicam in CYP2C9 genotype groups after a single 15 mg oral dose of meloxicam. Each value represents the mean ± SD. •, CYP2C9*1/*1 (n = 12); ▴, CYP2C9*1/*13 (n = 9)