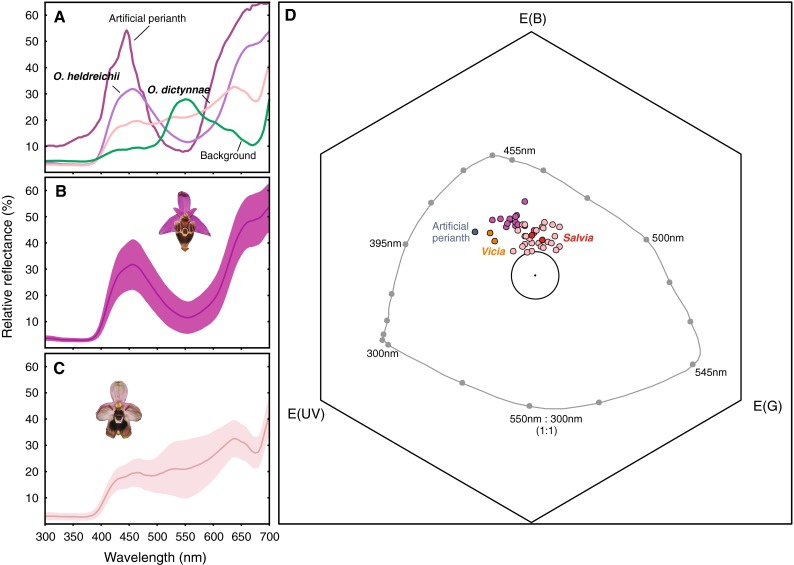
Fig. 3.

a–c Spectral reflectance curves of the perianth of Ophrys heldreichii (dark violet), Ophrys dictynnae (pale pink), the artificial perianth (dark pink) and the background (green) as a function of wavelength. In a only mean reflectance of the flower perianth are given (NO. heldreichii = 15, NO. dictynnae = 27, NBackground = 5, see text). b and c show the mean reflectance of O. heldreichii and O. dictynnae, respectively, presented with the standard deviation of the mean to visualize the variation within the species. d The colour loci of Ophrys heldreichii (dark violet), O. dictynnae (light pink), the artificial perianth and two major food plants (Vicia cracca and Salvia fructicosa) represented in the colour hexagon model (Chittka 1992). The large circle denotes 0.1 hexagon units around the centre. All loci within this circle are assumed to appear achromatic to the bee (Chittka and Kevan 2005). The grey line indicates the loci of pure spectral lights at background intensity. Colour distances in the hexagon space are calculated as the Euclidean distance between two loci (Chittka 1992)
