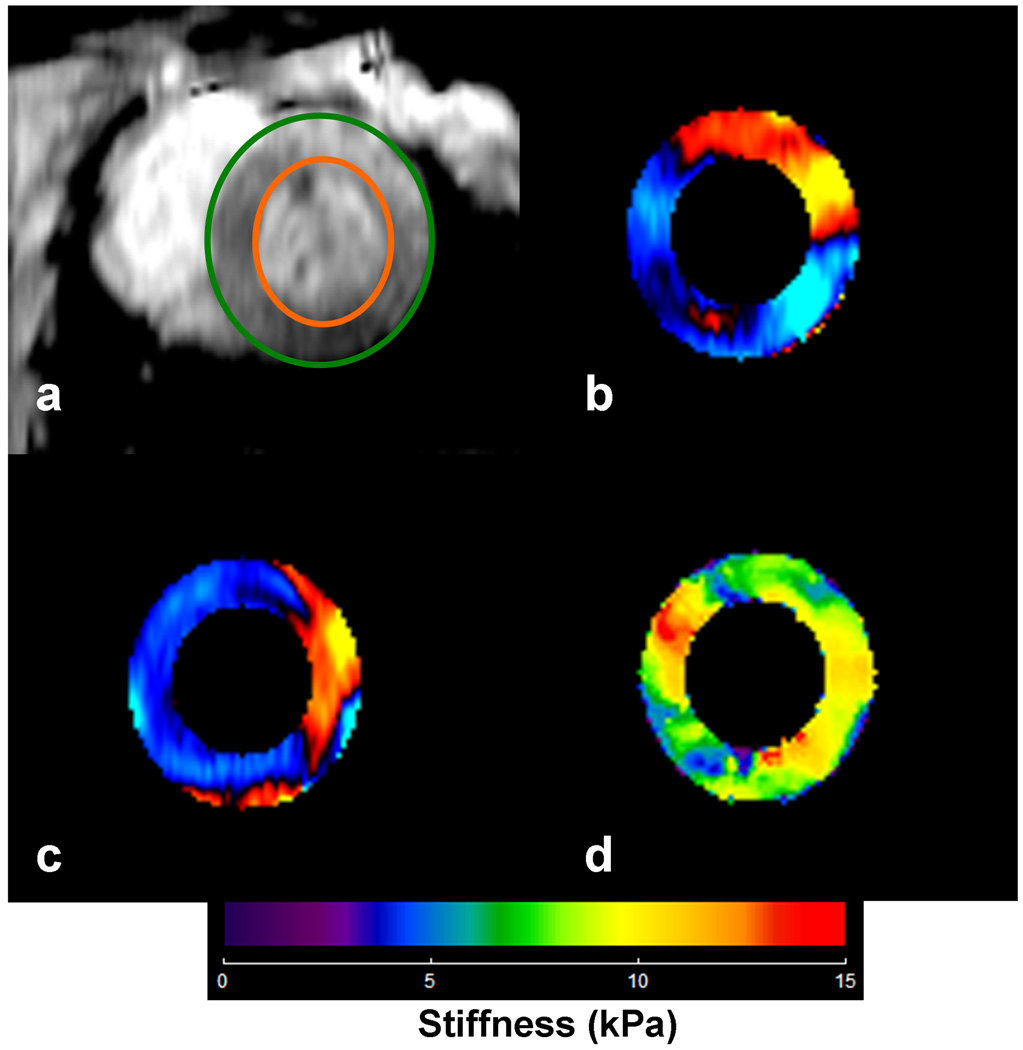
Figure 2.
a) End-diastolic short axis image of the LV avoiding the papillary muscles in pig #3 after 2nd infusion of dextran-40. The green and orange circles show delineation of LV myocardium. b, c) Corresponding radial and circumferential components of displacements obtained from MRE acquisition, which are provided as input to spherical shell inversion to obtain the stiffness map. d) Corresponding stiffness map at end-diastole with a mean stiffness of 8.4±2.4 (kPa). After the application of the correction factor the mean value is reported to be 8.9 (kPa).

