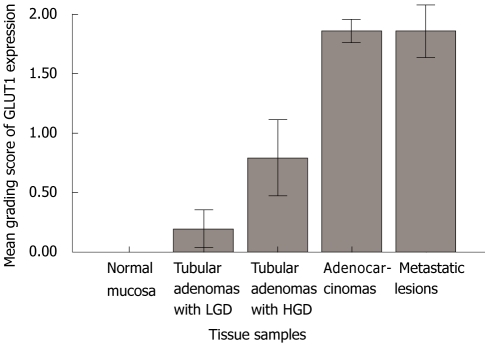
Figure 2.
Representation showing the difference of mean grading score of glucose transporter 1 expression in normal mucosa, tubular adenomas with low grade dysplasia, tubular adenomas with high grade dysplasia, adenocarcinomas, and metastatic lesions (lymph nodes and distant organs). One-way ANOVA test was used. GLUT1: Glucose transporter 1; LGD: Low grade dysplasia; HGD: High grade dysplasia.

