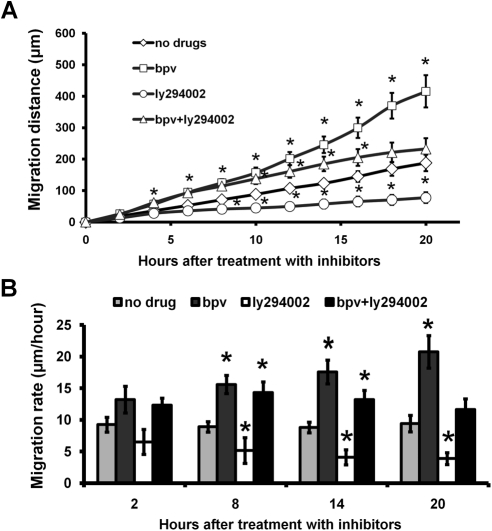
Figure 4.
PTEN inhibition accelerated the migration rate of HCE cells. (A) Immediately after media were changed with different inhibitors, time-lapse images were recorded for 20 hours. Migration distance of single cells was analyzed and presented. There are significant different between bpv(pic) treated and without treatment (no drug) group (P < 0.05) at each time point. (B) Immediately after media were changed with different inhibitors, time-lapse images were recorded for more than 20 hours. Migration rates were presented. PTEN inhibition with 1 μM bpv(pic) enhanced the migration rate, and this was partially counteracted by the addition of the PI3K inhibitor LY294002 (30 μM). Research imaging software was used to analyze cell migration. Values are presented as mean ± SE. *P < 0.05 compared with vehicle treatment by one-way ANOVA and individual comparisons by Tukey's procedure (n = 30–32 per group).

