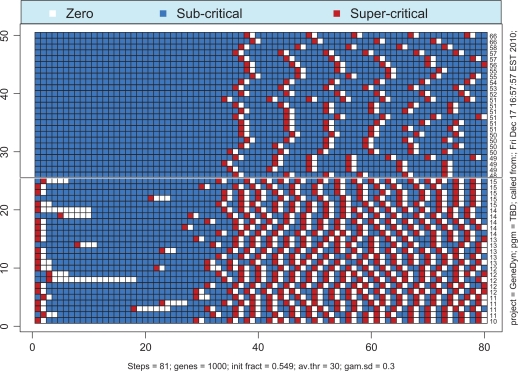
Figure 9.
Comparison of transitions to asymptotic oscillatory mode for the 25 simplest genes (minimal thresholds) with those for the most complex genes (maximal thresholds). The thresholds are given in ascending order on the left side of the graph with the smallest ones in the bottom. Transcription fires up from simple genes and propagates towards complex genes. The whole-genome oscillations emerge almost simultaneously.

