
Figure 2.
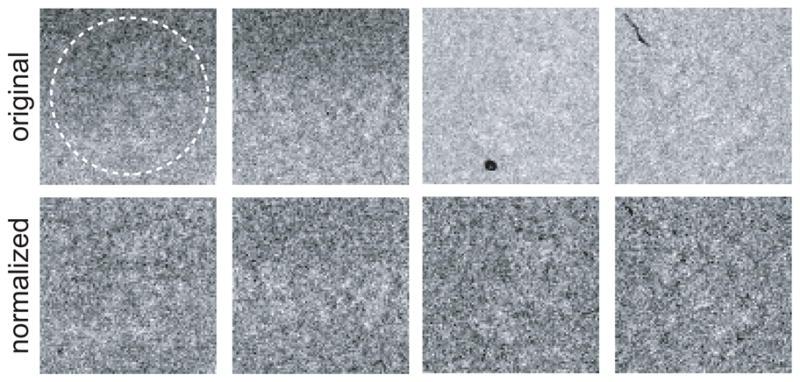
An illustration of image normalization. All pixels outside the white circle in the upper right image are assumed to contain only noise. These pixels are used to fit a least-squares background plane and to calculate the standard deviation of the noise. The upper row shows original images as they were extracted from the micrographs. The two images on the left show ramping backgrounds, the two images on the right show pixels with extremely low (i.e. black) intensity values. The lower row shows the same four images after normalization.