
Figure 3.
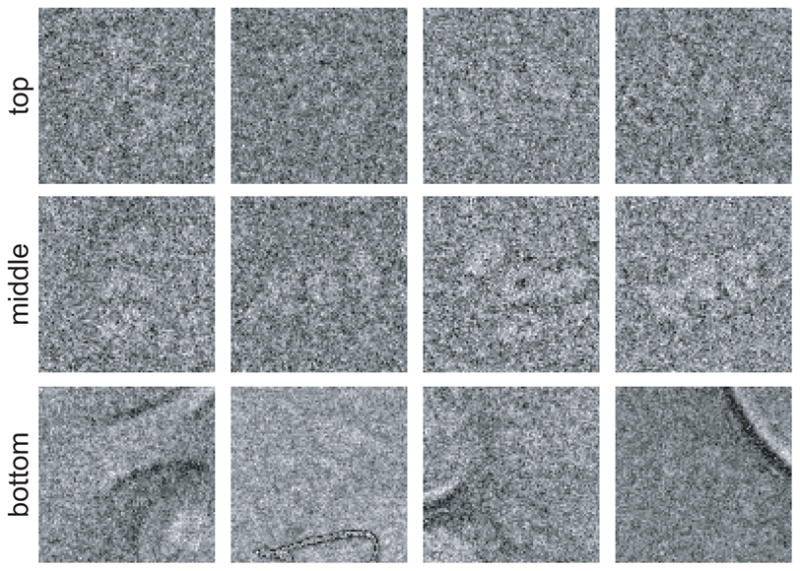
The results of automated image sorting based on average Z-scores. The top row shows images with relatively low Z-scores, the middle row images with average Z-scores and the bottom row shows images with relatively high Z-scores. The number of bad particles typically increases with higher Z-scores, which may facilitate the interactive removal of outliers by the user.