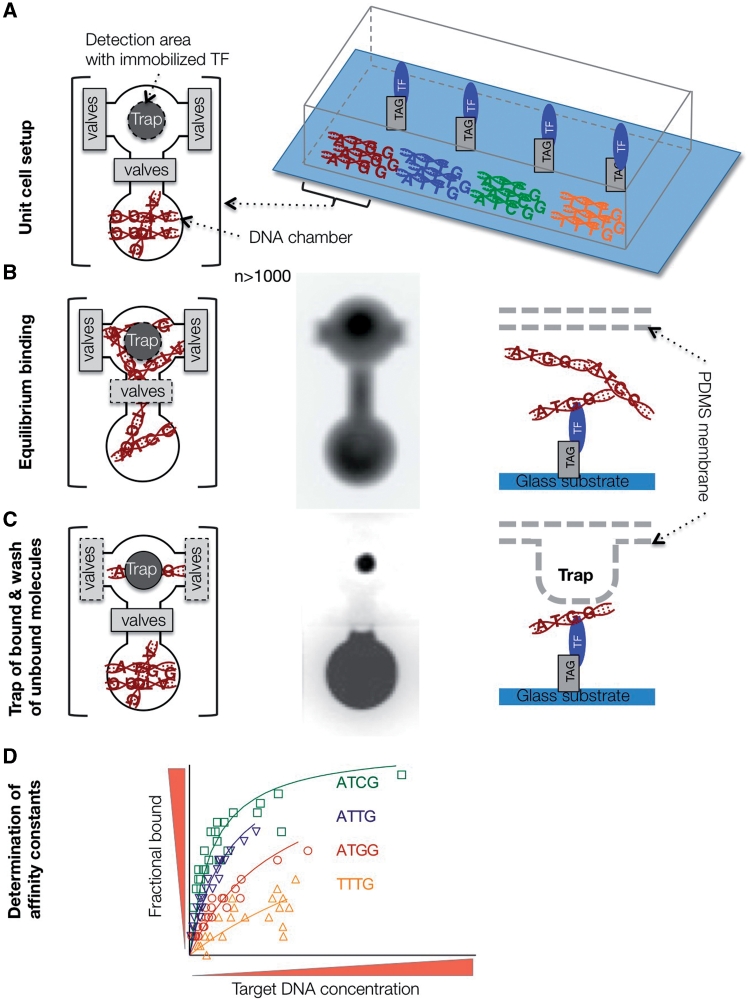
Figure 3:
Experimental flow chart of MITOMI. (A) Device setup. Target DNAs are spotted on a glass substrate and aligned to DNA chambers of the PDMS chip. One valve separates the DNA chamber from the detection area. TFs are immobilized by selective pull-down underneath the trap. Flanking valves separate unit cells. (B and C) A binding reaction is initiated after opening of DNA chamber valves, and diffusion of target DNA to detection area. Equilibrium bound fraction is separated from unbound fraction by mechanical trap and washing step. From left to right: Top view of unit cell, fluorescence image of diffused fluorescence tagged target DNA, and side view of detection area. (D) Binding affinity constants are determined by non-linear regression fitting of the saturation-binding curve obtained from the measurements.

