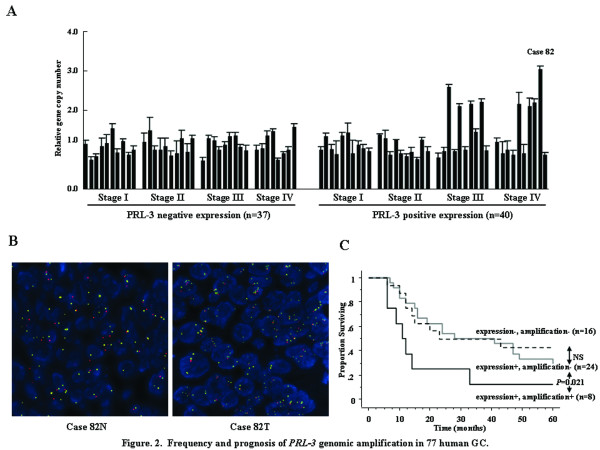
Figure 2.
Frequency and prognosis of PRL-3 genomic amplification in 77 human GC. (A) Frequency of PRL-3 genomic amplification using Q-PCR in 77 human GC. Q-PCR was performed for both the 40 tumors with positive PRL-3 expression and 37 tumors with negative expression. To normalize PRL-3 gene copy number per cell, ADAM2, located on chromosome 8p11.2, was used as an endogenous reference. ∆Ct values were calculated as Ct (PRL-3)-Ct (ADAM2) for each sample. Relative copy number was determined as 2-∆∆Ct, where ∆∆Ct = ∆Ct (tumor)-∆Ct (corresponding normal). (B) Representative FISH analysis of PRL-3 gene in primary tumor and corresponding normal (case 82). (C) Kaplan Meier curves of 5-year DSS according to the positivity or negativity of PRL-3 genomic amplification in the histologically node-positive patients. Error bars, standard deviation (SD).

