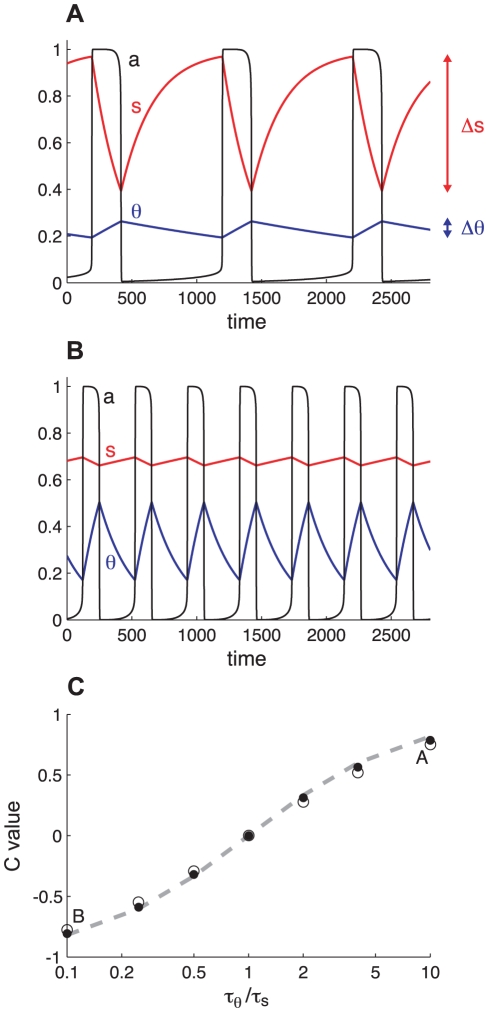
Figure 1. Illustration of the concept that the faster process contributes more to rhythm generation.
A. Time courses of activity (a, black), the synaptic recovery variable (s, red), and the adaptation variable (θ, blue) for τθ/τs = 10. The range of variation of s (Δs) is about 10 times larger than the range of variation of θ (Δθ). Thus, according to the correlative measure s contributes more to the rhythmicity. B. Similar time courses for τθ/τs = 0.1. The cellular adaptation now appears to contribute more than the synaptic recovery variable. C. Plot of the variations of C = (R−1)/(R+1) with the τθ/τs ratio. Closed circles obtained from simulations with θ0 = 0; open circles for θ0 = 0.18. When θ is much faster than s (τθ/τs is small), C is close to -1 indicating that θ is the dominant process. When τθ ≈ τs, C≈0 indicating that both processes have equal contribution to the rhythm. At large τθ/τs, C approaches 1 and s is the dominant process. Points labeled A and B refer to the cases illustrated in panels A and B. Dashed curve, variations of c = (r−1)/(r+1) with τθ/τs; r = (w/g)(τθ/τs) and w = g = 1. Results are similar if we keep τθ/τs = 1 and vary w/g instead.

