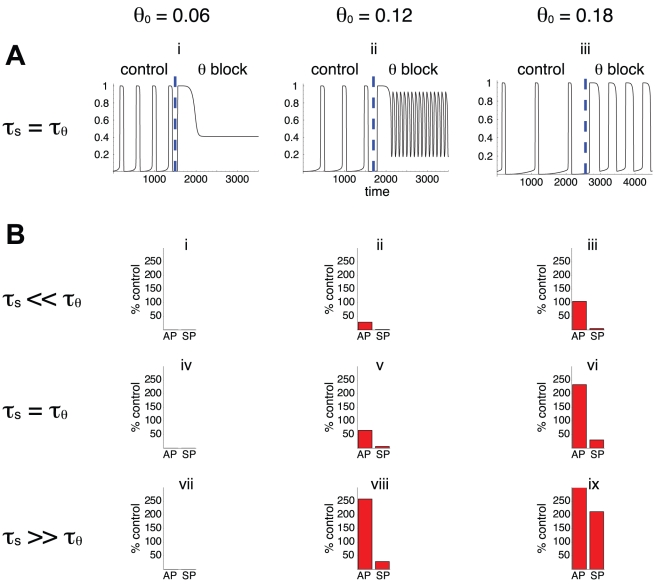
Figure 2. Illustration of the blockade approach.
A. time course of network activity before (“control,” g = 1) and after (“θ block,” g = 0) blocking the adaptation process θ. These simulations were obtained for τθ/τs = 1 and for the three values of θ0 indicated. Vertical dashed line indicates the time when the process was blocked. B. Effects of blocking θ on the lengths of the active and silent phases (AP, SP), represented as percentage of “control”. No bars are shown when rhythmic activity was abolished. There are more cases where θ block results in decrease of SP duration (ii, iii, v, vi, viii) than increase in AP duration (vi, viii, ix). The interpretation is that θ contributes more to delay episode onset than to provoke episode termination. The results of the blockade experiment depend on the value of θ0, the activity threshold in the absence of adaptation, unlike the predictions from the correlative approach (Figure 1C). The blockade experiments also produces similar results in pairs of cases (iii, v) and (vi, viii) that have different τθ/τs ratio; this is also in opposition to the correlative approach.

