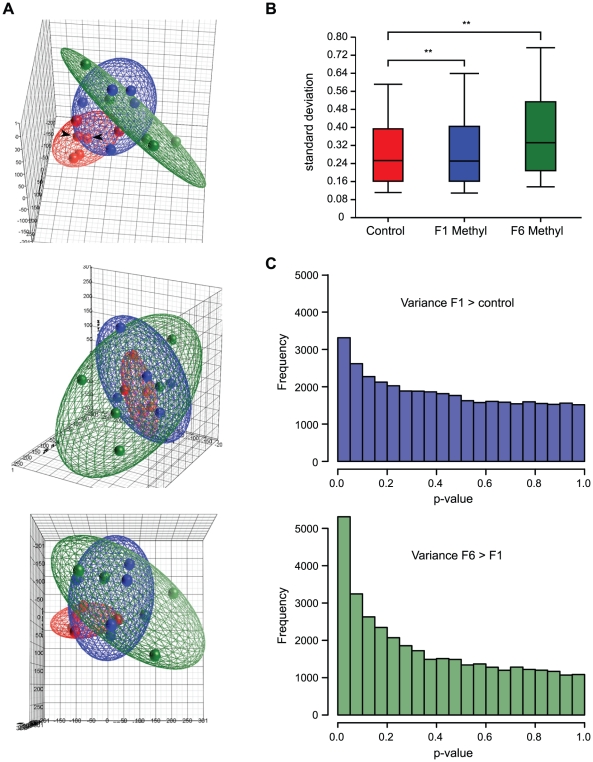
Figure 2. Methyl donor supplementation increases epigenetic variation in exposed mice.
(A) Pseudo three-dimensional plot showing principal components analysis (PCA) of microarray data from control (red) and F1 (blue) and F6 (green) supplemented mice. The same plot is shown from three different perspectives. The ellipsoids around the PCA scores of each group were determined by standard deviations, so that their size is indicative of the overall variance within the group. (B) Box-and-whisker plots showing distribution of standard deviation values of intra-group log Cy3/Cy5 ratios across all microarray probes. Whisker lines indicate 90th and 10th percentile values. ** = p<0.0001. (C) Frequency histogram showing the number of probes with the given probabilities of higher variance (upper panel) in F1 supplemented than control animals, and (lower panel) in F6 than F1 supplemented animals. The accumulation of probes with small p-values indicates that more probe signals are significantly more variable in F1 than control, and F6 than F1.

