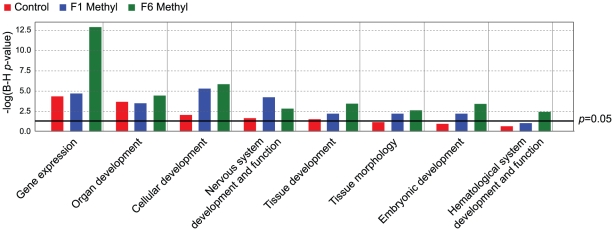
Figure 4. Gene ontology analysis of methylation-variable genes in unsupplemented and supplemented mice.
Graph from IPA showing gene ontology categories significantly overrepresented in the genes defined as methylation-variable in control and F1 and F6 supplemented mice. The black line indicates a significance threshold of p = 0.05 with Benjamini-Hochberg correction for multiple testing.

