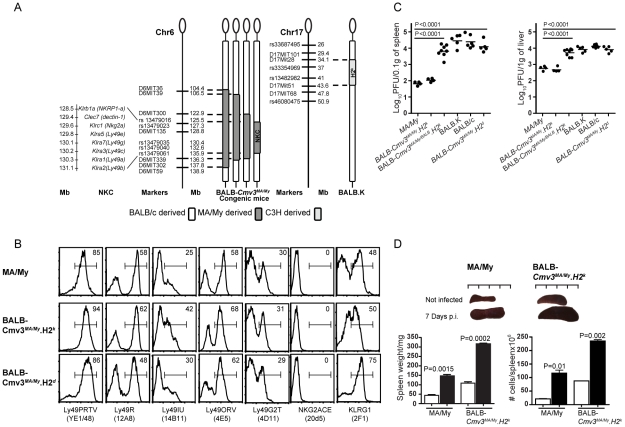
Figure 1. Generation, phenotype, and MCMV infection outcome of BALB mice congenic for the natural killer gene complex inherited from MA/My mice.
(A) Left, physical map of chromosome 6 markers used to determine the size of the MA/My fragment introgressed into the BALB background. The four versions of chromosome 6 indicate the genotypes of sub-congenic strains produced during the generation of BALB.Cmv3MA /My congenic mice carrying a 10 Mb segment (between SNPs rs13479016 and rs13479061) spanning the NKC region from parental MA/My mice. Right, physical map of chromosome 17 markers used to characterize the 9.4 Mb segment (between D17Mit28 and D17Mit51) comprising the H2 region of BALB.K mice (H2k). (B) NK cell receptor expression in MA/My parental mice and derived BALB-Cmv3MA/MyH2d and BALB-Cmv3MA/MyH2k congenic mice. The receptors (indicated on the bottom of the panel) were gated by FACS on NKp46+ splenic NK cells; the proportion of expression is indicated in each histogram. (C) Viral load in spleens (left) and livers (right) of mice of the indicated genotypes, as determined by plaque-forming assays 3 days p.i. (D) Spleen size (top) and weight and total cellularity (bottom) determined in MA/My and BALB-Cmv3MA/MyH2k mice at 7 days p.i. White bar, uninfected mice; black bar, MCMV-infected mice. Data were analyzed using two-way ANOVA analysis and the two-tailed Student's test. Data are presented as mean ± SEM and P values of significant differences between groups are indicated. Results shown in panel B are representative of three experiments using 2–3 mice per group; results shown in panels C and D are representative of five independent experiments using 3–8 mice per group.

