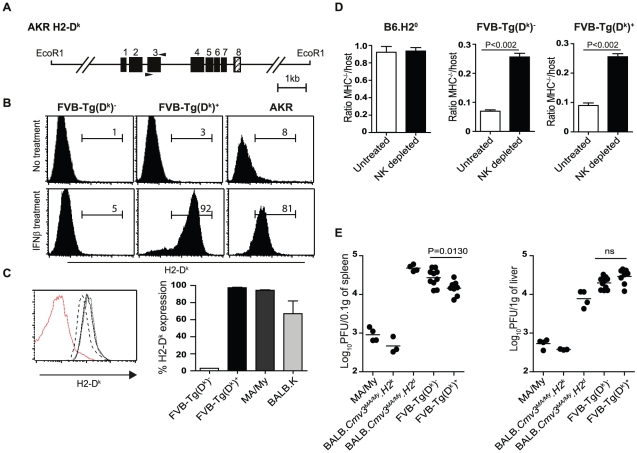
Figure 3. Functional characterization of H2-Dk transgenic mice.
(A) Schematic representation of the H2-Dk gene within the 11.5 kb EcoRI genomic DNA fragment from AKR mice used to generate transgenic mice. (B) Expression of H2-Dk on MEFs from FVB/N nontransgenic (FVB-Tg(Dk)−, transgenic FVB-Tg(Dk)+, and AKR (H2k) mice. MEFs from FVB-Tg(Dk)+ and wild-type littermates were prepared from PCR-typed embryos, untreated or incubated overnight with 100 U/ml IFN-β prior to analysis of H2-Dk expression by FACS. (C) H2-Dk staining on lymphocytes from FVB-Tg(Dk)− (red peak), BALB.K (dashed peak), MA/My (black peak), and FVB-Tg(Dk)+ (dotted peak) mice. Bar graph shows quantification of the percentage of H2-Dk expression from 2–3 mice per group. (D) Splenocytes from B6.H20 mice or NKC/H2 histocompatible mice were inoculated into either untreated or asialo-GM1–treated NK cell–depleted hosts. Ratio values indicate the relative survival in the test population (CFSEhigh) compared to the histocompatible control population (CFSElow) at 18 hours after injection. Three mice per group were analyzed. Statistical significance between untreated and NK-depleted mice is shown. (E) Viral load in spleens (left) and livers (right) of mice of the indicated genotypes was determined by plaque-forming assays at day 3 p.i. Data were analyzed using two-way ANOVA analysis and the two-tailed Student's test. Data are presented as mean ± SEM and P values of significant results between groups are indicated. Results shown are representative of 2–3 independent experiments.

