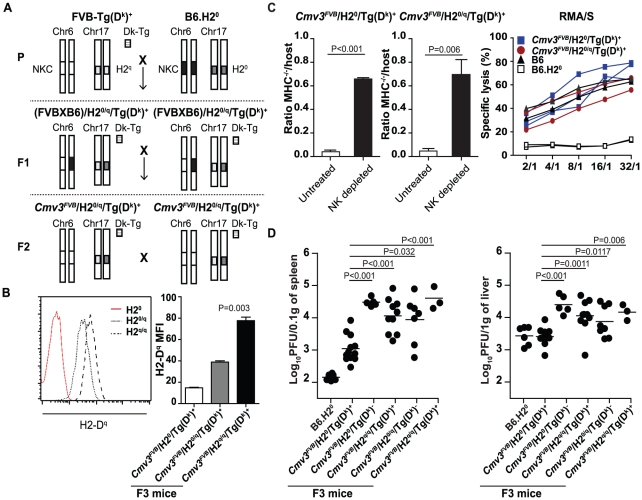
Figure 4. Functional characterization of F3 mice carrying the NKC from FVB/N and different assortment of H2 molecules.
(A) Breeding scheme for the generation of F3 mice carrying the NKC loci from FVB/N parental mice and various combinations of H2 loci. The NKC, H2, and H2-Dk transgenic loci are represented by boxes, as indicated. The parental (P) FVB-Tg(Dk)+ and B6.H20 strains were mated to generate the F1 generation. Subsequently, F2 mice carrying an homozygous FVB/N NKC locus and heterozygous for either the H2 or the H2-Dk transgene were kept and intercrossed to generate the F3 mice with different H2 assortments (H20: H2-Kb −/− Db −/−). (B) H2-Dq staining of lymphocytes from Cmv3FVB/H20/Tg(Dk)+ (H20 red peak), Cmv3FVB/H20/q/Tg(Dk)+ (H20 /q, dot peak), and Cmv3FVB/H2q/q/Tg(Dk)+ mice (H2q/q, dashed peak). Histograms on the right represent the quantification of the level of H2-Dq expression analyzed in three mice per group. (C) Rejection of B6 MHC class I–deficient cells in vivo by the indicated hosts was assessed as in Figure 3, and statistically significant differences are shown. IL-2–derived NK cells from the indicated mouse strains were co-cultured with CFSE-labeled RMA/S cells. Specific lysis at the indicated effector/target ratios was assessed by staining with 7-AAD and analyzed by FACS. Values represent the mean of 2–3 mice per group. (D) Viral loads in spleens (left) and livers (right) of parental and F3 mice of the indicated genotypes were determined by plaque assay at day 3 p.i. Results shown represent five pooled experiments. Data were analyzed using two-way ANOVA analysis and the two-tailed Student's test. Significant P values for differences between groups are indicated.

