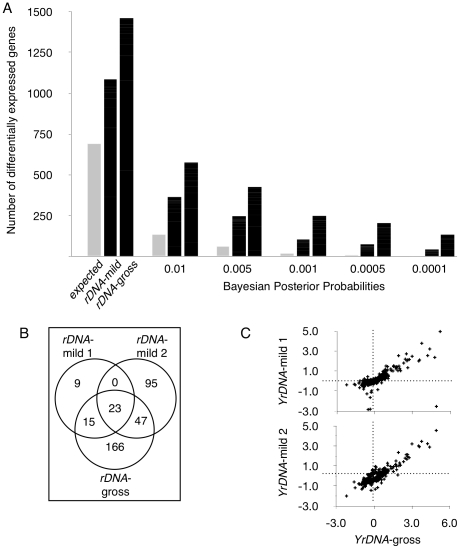
Figure 1. Induced deletions in the rDNA locus result in the differential expression of hundreds of genes.
(A) Number of differentially expressed genes for Y chromosomes bearing deletions within the ribosomal DNA (rDNA). Data are given at P<0.05 (first set of data) and other indicated Bayesian Posterior Probabilities. Expected values are calculated from permuted datasets and shown in light gray. rDNA-mild are average numbers for two chromosomes with 87% and 85% wild-type copy number of rDNA, and rDNA-gross is a chromosome with 46% of wild-type rDNA (Figure 6). (B) Venn diagram showing number of differentially expressed genes in each rDNA deletion line relative to the wild-type chromosome (at P<0.001, FDR<0.05). (C) Correlation between the magnitude of change in gene expression (log-fold-changes) for YrDNA-gross (abscissa) and either YrDNA-mild-1 (ordinate – Top panel) or YrDNA-mild-2 (ordinate – Bottom panel). ρ = 0.84 and 0.78, respectively. Fold-changes are for contrasts between each rDNA deletion line and the wild-type chromosome.

