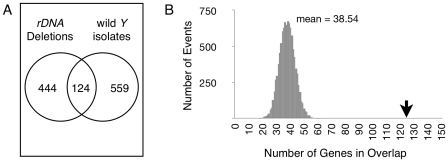
Figure 4. Differentially expressed genes are shared between chromosomes with induced rDNA deletions and naturally occurring Y chromosomes.
(A) Venn diagram showing number of differentially expressed genes unique to Y chromosomes with induced rDNA copy number changes (“rDNA Deletions”) or natural Y chromosomes (“wild Y isolates”), and overlap of genes common to both groups (at P<0.005). (B) Event histogram showing that 10,000 randomly-generated datasets produces an average of 38.54 genes shared between rDNA Deletions and wild Y isolates. Arrow shows the observed value of 124 (from (A)).

