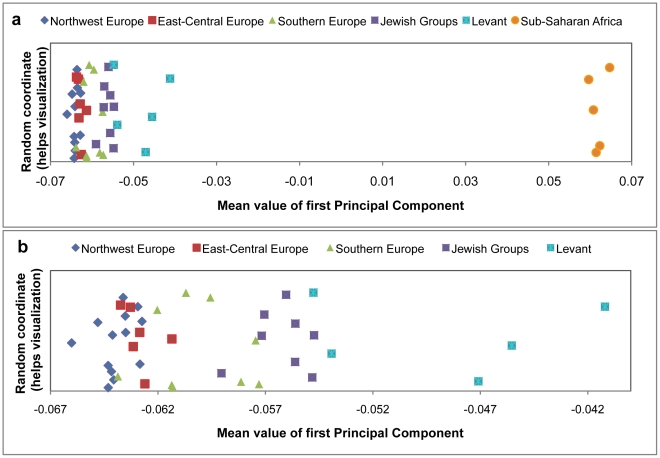
Figure 1. PCA Projection.
PCA was performed using genome-wide SNP data from East Asians (HapMap3- CHB) and South Africans (HGDP-CEPH- San). All West Eurasians populations with samples sizes of n ≥ 5 were then projected onto these PCs. (a) The first panel presents data for all populations and (b) the second panel provides a higher resolution view of West Eurasians after removing sub-Saharan Africans. Each point on this graph indicates the mean value of the first PC for a projected population. West Eurasians populations are colored by 5 regional groupings—“Northwest Europe”, “East-Central Europe”, “Southern Europe”, “Levant”, “Jewish Groups” (the assignments of populations to groups is shown in Table 1). The grouping “Sub-Saharan Africa” refers to six populations from the HGDP-CEPH panel: Kenyan Bantu, South African Bantu, Mandenka, Mbuti Pygmy, Biaka Pygmy and Yoruba.

