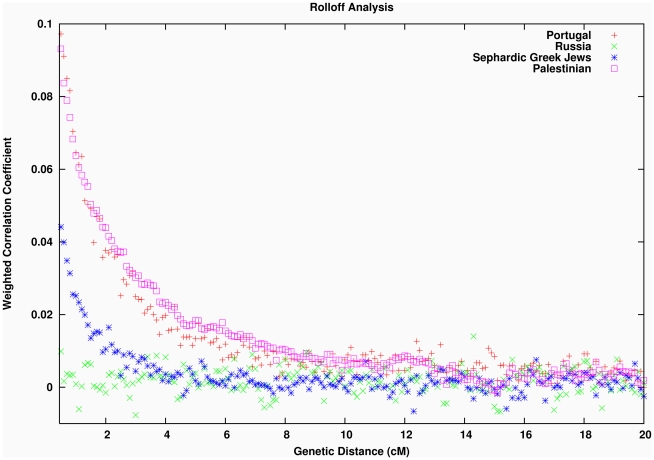
Figure 3. Testing for LD due to African admixture in West Eurasians.
To generate these plots, we used the ROLLOFF software to calculate the LD between all pairs of markers in each population, weighted by their frequency difference between YRI and CEU to make the statistic sensitive to admixture LD. We plot the correlation as a function of genetic distance for Portuguese, Russians, Sephardic Greek Jews and Palestinians. We do not show inter-SNP intervals of <0.5cM since we have found that at this distance admixture LD begins to be confounded by background LD, and so inferences are not reliable (exponential curve fitting does not include inter-SNP intervals at this scale).

