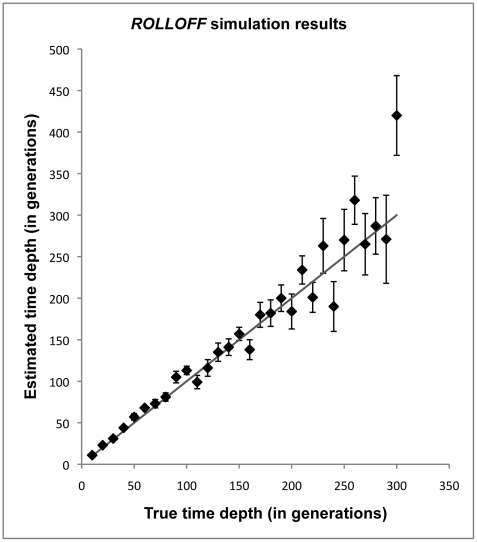
Figure 4. ROLLOFF simulation results.
We constructed 10 individuals of mixed African and European ancestry (where individuals had 20% European ancestry) for various time depths ranging from 10–300 generations (with intervals of 10 generations). We performed ROLLOFF analysis using another independent dataset of European Americans and Nigerian Yoruba individuals as reference populations. We plot the true time depth (that was used for the simulations) against the estimated time depth computed by ROLLOFF. The expected time depth is shown as a dotted grey line. Standard errors were calculated using the Weighted Block Jackknife described in the Materials and Methods.

