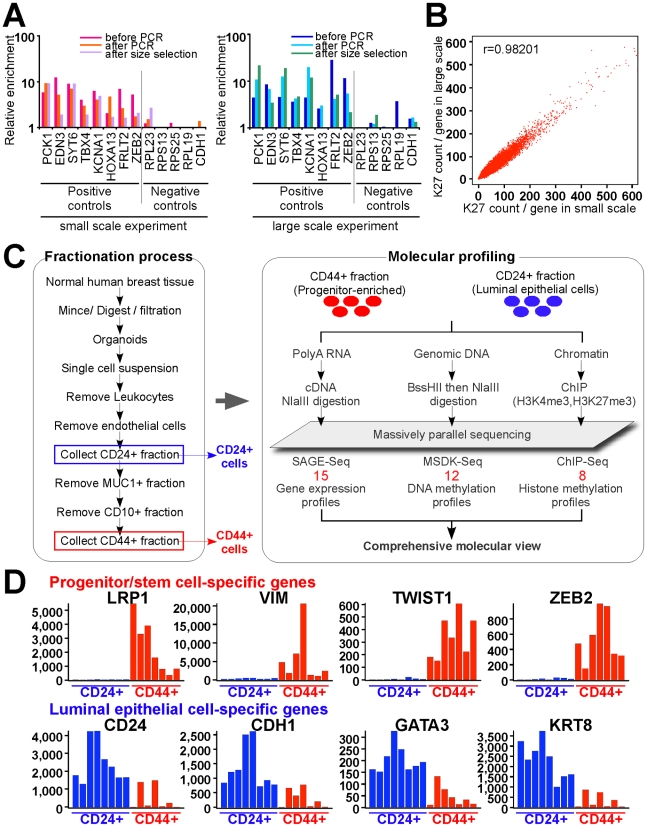
Figure 1. Overview of experimental design and data analysis.
(A) qPCR validation steps during ChIP-Seq library preparation using small and large scale protocols. Several regions known to be K27-enriched (positive controls) or not-enriched (negative controls) in MCF-7 cells were tested by qPCR using DNA templates before and after linker-mediated PCR amplification and after size-selection. Y-axis indicates enrichment relative to averaged negative controls. (B) Comparison of small-scale and standard ChIP-Seq experiments. Scatter plots depict the counts of ChIP-Seq reads for each gene. X and Y-axes indicate mapped read counts around promoter regions (+/− 5 kb from TSS) for each gene in small-scale and in standard experiment, respectively. (C) Schematic view of cell purification and sample processing. Red numbers indicated the number of independent samples in each data type. (D) Representative examples of genes known to be specifically expressed in luminal (blue) and stem (red) cells. Each bar represents a different sample. Y-axis indicates SAGE-Seq tag counts.

