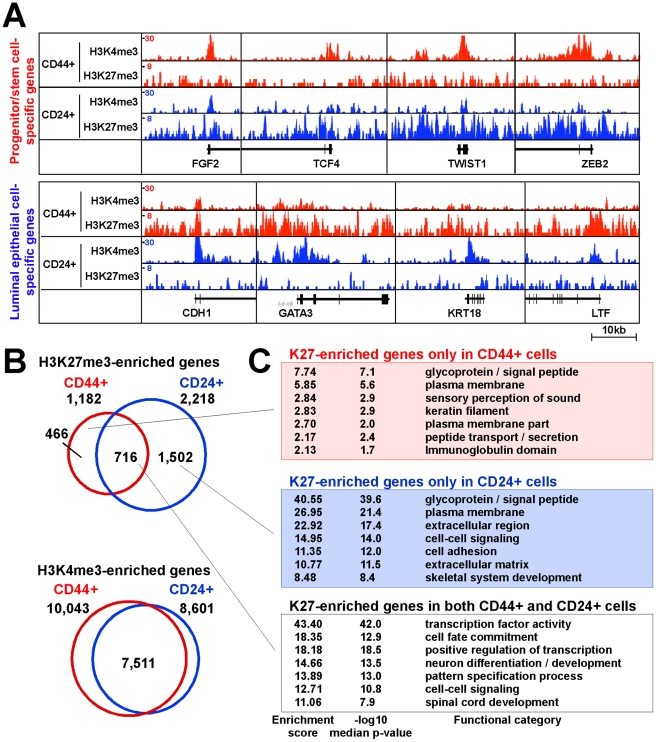
Figure 2. Distinct histone methylation profiles of human CD44+ mammary epithelial progenitors and CD24+ differentiated luminal epithelial cells.
(A) Examples of histone modification patterns of genes known to be expressed in stem or luminal cells. Total aligned tag count in each ChIP-Seq library was scaled to 10 million, Y-axis shows tag counts averaged over a 10 bp window. (B) Comparison of genes enriched for the indicated histone marks in CD44+ and CD24+ cells. Venn diagram depicts the number of unique and overlapping genes. (C) Functional enrichment analysis of K27-enriched genes using DAVID Functional Annotation Tool.

